Graph your PC's CPU, GPU, RAM, disk and network on Stream Deck keys
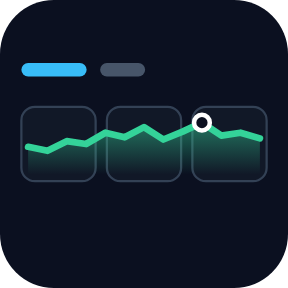
To see a graph of your CPU, GPU, RAM, disk or network speed on a Stream Deck, add Windows Performance Graph Keys and drag Performance Graph onto a key. Each key graphs the last 1, 5, 15 or 60 minutes, so you can spot the spike behind a stutter, a slow export or a busy download, and keys placed side by side join into one long graph.
Stream Deck plugin · Works on Windows 10 or later with the Stream Deck app 6.9 or later.
What you can do
See how a reading moved: CPU, GPU, memory, disk, download or upload as a graph of the last 1, 5, 15 or 60 minutes.
Make it wide: keys in one row join into one long graph when they show the same reading, period and look.
Find the peak: a ring and a MAX label mark the highest reading of the period.
Press a key for the max, the average and how long ago the max was.
Hold a key to switch between 1, 5, 15 and 60 minutes.
Watch four readings on one key: Performance Overview shows CPU, GPU, memory and network (or disk) as four small graphs.
Catch the yellow and red: CPU, GPU, memory and disk turn yellow from 70% and red from 90%.
Pick a look: Classic, Neon, Bars, Solid or Grid. English and Japanese.
Nothing else to install: no sensor app, no account and no admin rights. Readings stay on your PC, and recording continues for 60 minutes after you switch pages.
How it works
Install the plugin from the Elgato Marketplace. In the Stream Deck app, drag Performance Graph onto a key.
In the key's settings, choose the Reading (CPU, GPU, memory, disk, download or upload), the Period and the Look.
For a wider graph, drag more Performance Graph keys next to it in the same row with the same settings. Hold a key to change the period.
The plugin reads usage numbers directly from Windows, including Windows' own GPU counters, and keeps them in memory on your PC.
How do I show a CPU or GPU usage graph on my Stream Deck?
Drag Performance Graph onto a key and choose CPU or GPU as the Reading. The key graphs the last 5 minutes at first, and you can hold it to switch to 1, 15 or 60 minutes.
How can I find the spike that made my PC stutter?
Look for the ring and the MAX label on the graph, which mark the highest reading of the period. Press the key to see the max, the average and how long ago the max was.
Can I make one long graph across several keys?
Yes. Put Performance Graph keys side by side in the same row and give them the same reading, period and look. They join into one graph.
Does it need a sensor app or admin rights?
No. It reads Windows directly, with no sensor app, no account and no admin rights, and the readings stay on your PC.
Which GPU does it follow?
It shows the busiest engine of your GPU, from the GPU counters in Windows. With two GPUs, such as built-in and dedicated, the graph follows the busier one.
Limits
It shows usage and speed. Temperatures, fan speeds, clock speeds and FPS are outside its scope.
Network readings come from your PC's physical network adapters.
If Windows offers no GPU counters on a PC, for example with a very old graphics driver, the GPU key says no reading. The other readings keep working.
History is kept in memory only, for up to 60 minutes. Restarting the Stream Deck app or the PC starts the graphs afresh, and nothing is recorded while the PC sleeps.