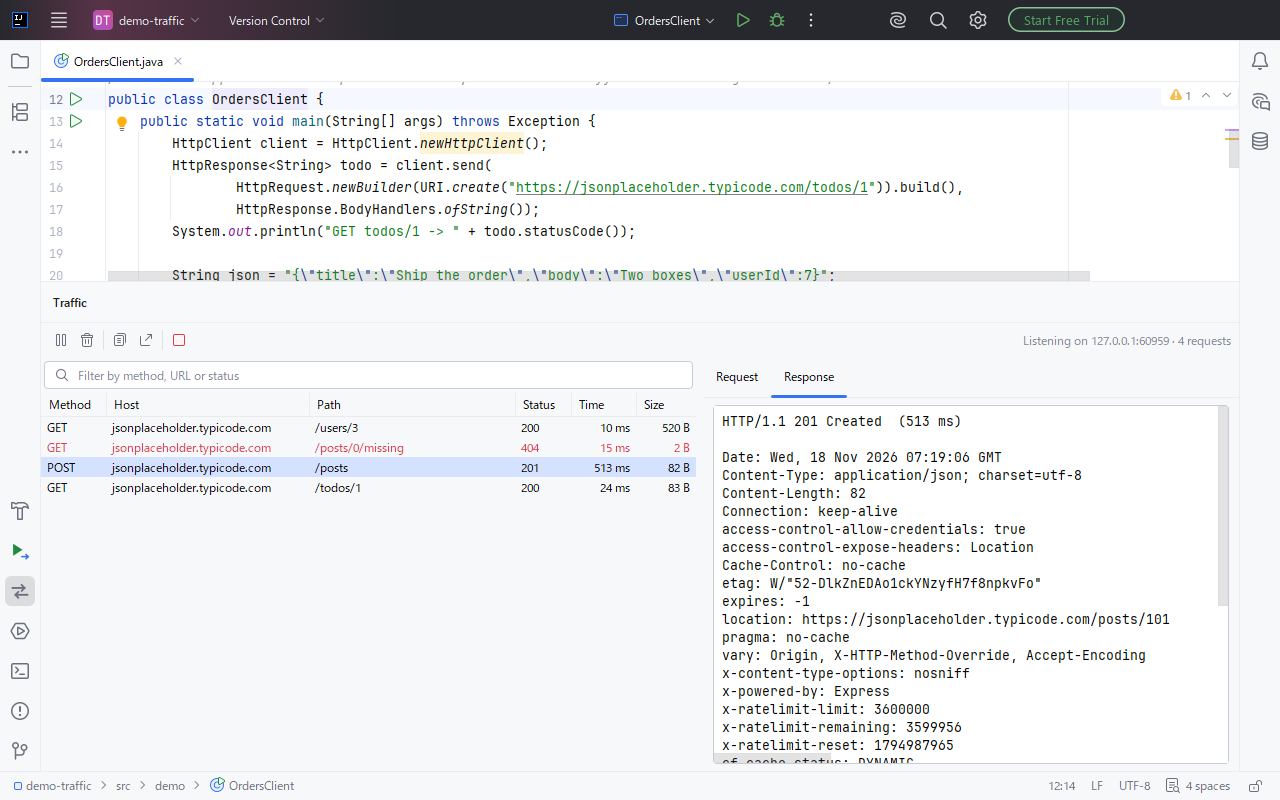
Every request, as it happens
Method, host, path, status, time and size, newest first. Select a row to see the request and response headers and bodies, with JSON indented.
JetBrains IDE plugin
See every HTTP and HTTPS request your app sends, next to your code. Click Run with Traffic instead of Run, and each request is listed with its status, headers and bodies while the app runs. Nothing to install on your system.
Get it on JetBrains MarketplaceFree trial with every feature.
Method, host, path, status, time and size, newest first. Select a row to see the request and response headers and bodies, with JSON indented.
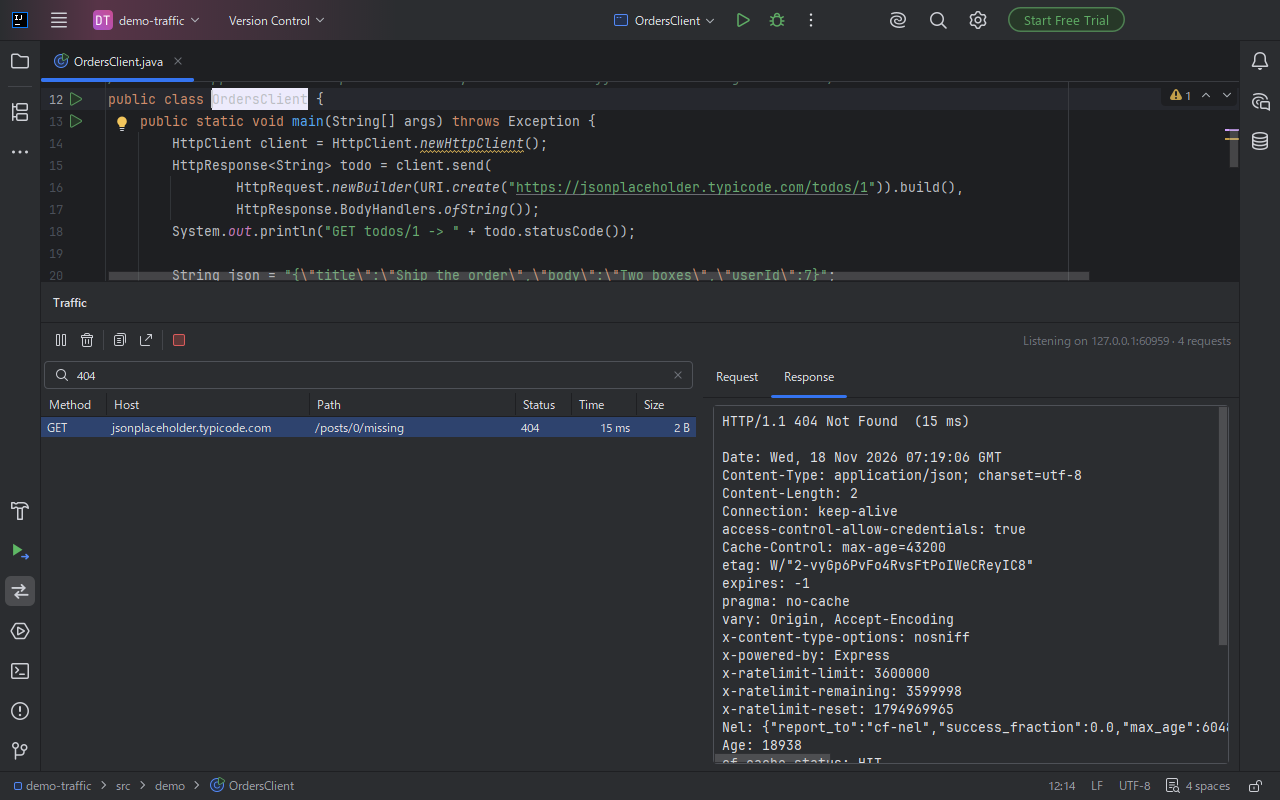
Error statuses and failed requests are red. Filter by method, URL or status to keep only the requests you are fixing.
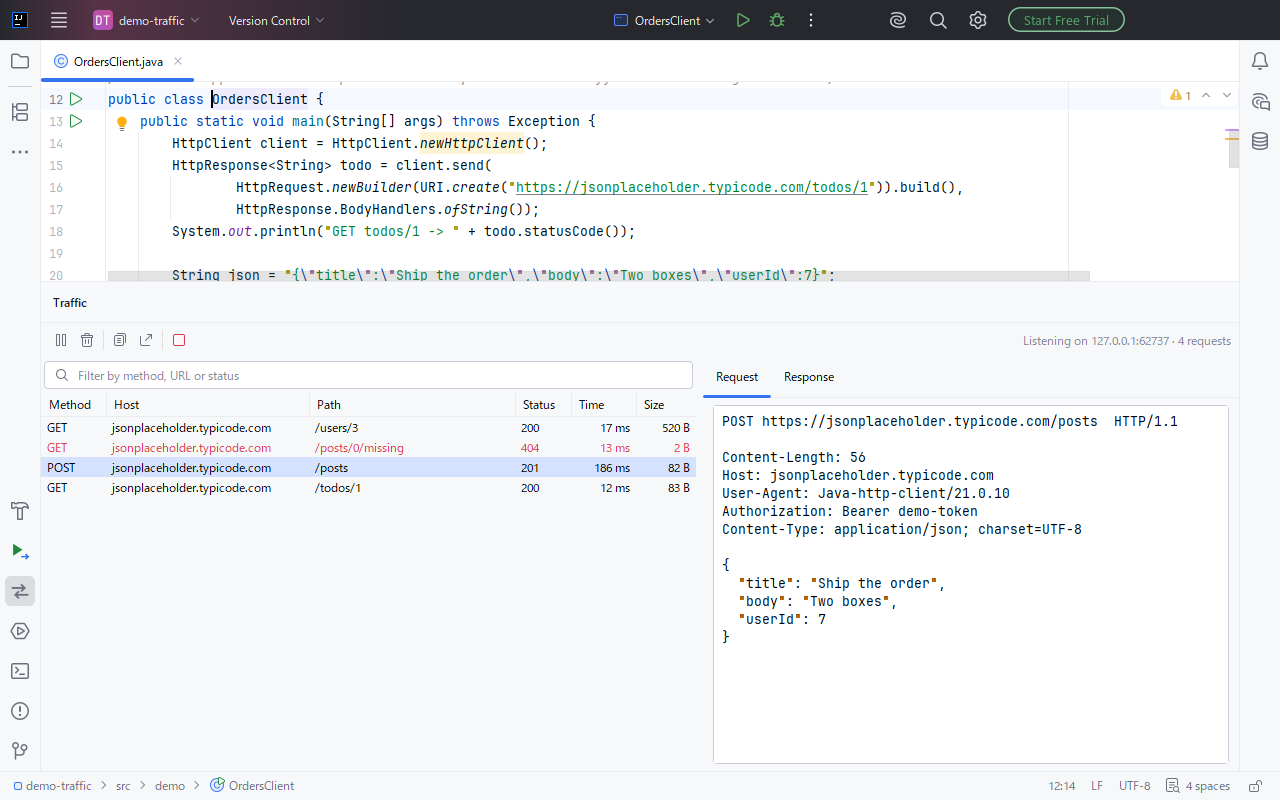
The Request tab shows the headers and body your code sent, and the Response tab shows what the server sent back. Copy the request as a curl command, or save the list as a HAR file with secrets hidden.
Application and JUnit run configurations, and Gradle runs and tests. Clients that follow the standard Java proxy settings are recorded, such as HttpURLConnection, the JDK HttpClient, Apache HttpClient built with system properties and OkHttp with the default proxy selector.
Node.js run configurations and npm, yarn and pnpm scripts: the built-in http, https and fetch in recent Node.js versions, and axios.
HTTPS is shown decrypted. Responses reach your app as they arrive, so server-sent events and long downloads behave as usual. WebSocket handshakes are listed.
The recent_http_traffic tool lets an agent read the latest requests through the IDE's built-in MCP server, with tokens, keys, passwords and cookies hidden.
Your run configurations and your system settings are not changed.
Install Run Traffic Inspector from Settings | Plugins | Marketplace, then start your Application or JUnit run configuration with Run with Traffic instead of Run. Every request the app sends through the standard Java proxy settings, such as HttpURLConnection and the JDK HttpClient, is listed in the Traffic tool window with its URL, status, headers and bodies.
Start the Node.js run configuration, or an npm, yarn or pnpm script, with Run with Traffic. Requests from the built-in http and https modules (Node.js 24.5 or later, or 22.21 or later), the built-in fetch (Node.js 24 or later) and axios are listed with their decrypted headers and bodies. If your Node.js version cannot record a client, a notification names the version.
Run the app with Run with Traffic and select the failing request in the Traffic tool window. Error statuses are shown in red, and the Request and Response tabs show the exact headers and body that were sent and the error message the server returned. Copy as curl lets you send the same request again from a terminal.
No. The recorder runs inside the IDE on 127.0.0.1 and its certificate is kept in the IDE's settings folder. Nothing is added to the operating system's certificate store, the system proxy is not changed and your run configurations are not edited. The settings are passed only to the process that Run with Traffic starts.
Yes, when the run already uses an HTTP proxy: http.proxyHost and https.proxyHost in the Java options, or HTTPS_PROXY and HTTP_PROXY for Node.js. The requests go on through that proxy and its exceptions are kept. A run that uses a SOCKS proxy, a PAC file, the system proxy settings or an https:// proxy starts as usual without recording, and the plugin tells you why.
Yes. In IDEs that include the built-in MCP server, the plugin adds the recent_http_traffic tool, so Claude Code, Codex or any MCP client can read the latest recorded requests while it fixes an API call. Tokens, keys, passwords, cookies and other secret values in headers, URLs and bodies are replaced with [hidden] in what the tool returns, and Export HAR hides them the same way.
Java and Gradle run configurations: IntelliJ IDEA. Node.js and npm run configurations: IntelliJ IDEA, WebStorm, PhpStorm, PyCharm, GoLand, RubyMine and Rider with the Node.js plugin enabled. Version 2025.2 and later, on Windows, macOS and Linux.
The requests are recorded on your computer and kept in the IDE's memory; they are not sent anywhere. If an error occurs inside the plugin, the IDE may offer to send an error report to JetBrains Marketplace. See the privacy policy.
If something does not work as expected, or a client or run configuration you use is missing, email gramshift.official
Annual or monthly subscription, with a free trial that has every feature. An annual subscription includes a perpetual fallback license, so you keep a working version even if you stop subscribing.
localhost and 127.0.0.1 are not recorded. Runs must start on this computer; WSL, SSH and Docker targets are not recorded.axios, such a request fails with status 502 and is listed as failed.br and zstd are removed from Accept-Encoding so that bodies can be shown.Stop guessing what your code sent. See it.
Get Run Traffic Inspector